
Statistics
The Statistics section shows you how the store is doing: sales, products, users, newsletters and customer reviews. It has two tools inside the BE and three shortcuts to external services:
Eshop Statistics
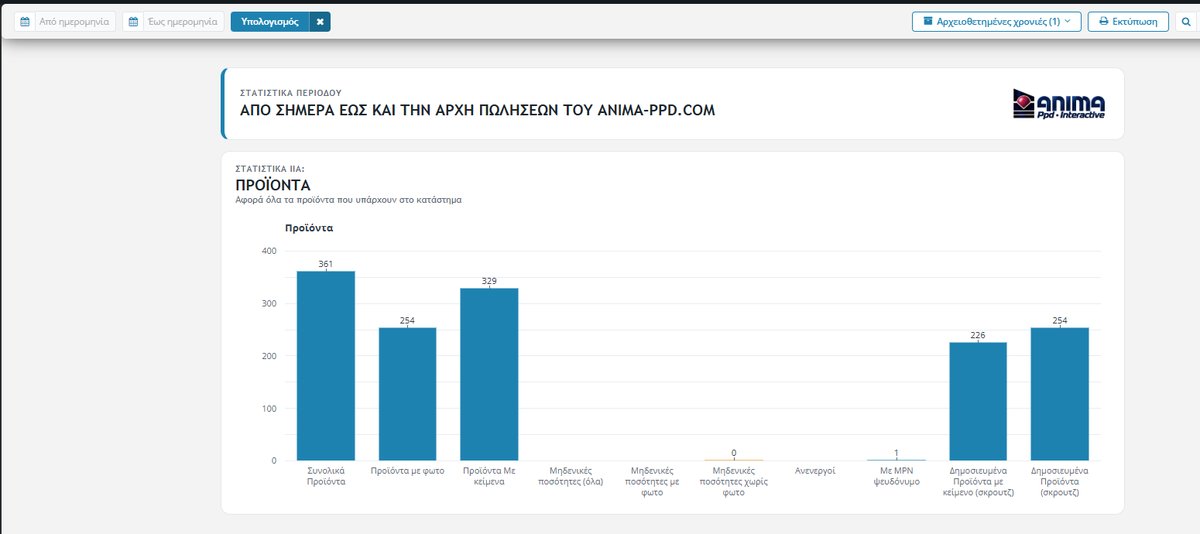
One large page with charts and numbers for the whole store. By default it shows the entire period, from today back to the start of sales.
The toolbar
- From date / To date: you set the period (e.g. from a month ago until today) and press Calculate. The ✖ clears the dates.
- Archived years: if you have archived old orders (Orders Backup), here you add them to the calculation so they are not lost from the statistics.
- Print, Search within the page and Maximise the space.
What it contains
- Products: how many there are in total, how many have a photo or text, how many have zero quantities (with or without a photo), how many are inactive, how many have an MPN alias and how many are published (also for Skroutz).
- Manufacturers: how many are registered, how many have products, how many appear in the store menu and how many have text.
- Products that sold the most pieces: the ranking of best sellers with their pieces, as well as the total pieces in the warehouse and the largest order by amount.
- Users: all, active, those who have bought, with favourites, administrators, inactive, B2B and connected operators.
- Newsletters: how many people each mailing reached.
- Customer feedback: the average rating (up to 5) for communication with the store, the likelihood of recommending you to a friend and the speed of shipping, as well as where they found you (e.g. Skroutz, Facebook, advertising).
- Appointments: when the appointments extension exists, appointments are shown per month, task and hour.
Sales and orders
The financial statistics (sales totals, cancellations, refusals of delivery, sales of the last 7 days, payment methods, cancellation reasons, exchanges / replacements / returns, basket value and quantity, shipping costs and comparisons of sales, orders and cancellations) are displayed depending on the permissions granted to each eshop.
Product Statistics

A table showing how much each product sells. Each row shows:
- The product’s MPN, Description, Category and Colour,
- Sizes that were sold, with the number per size (e.g. “M x 2”),
- Period Sales and Total Sales,
- Visits to the product page and the current Stock.
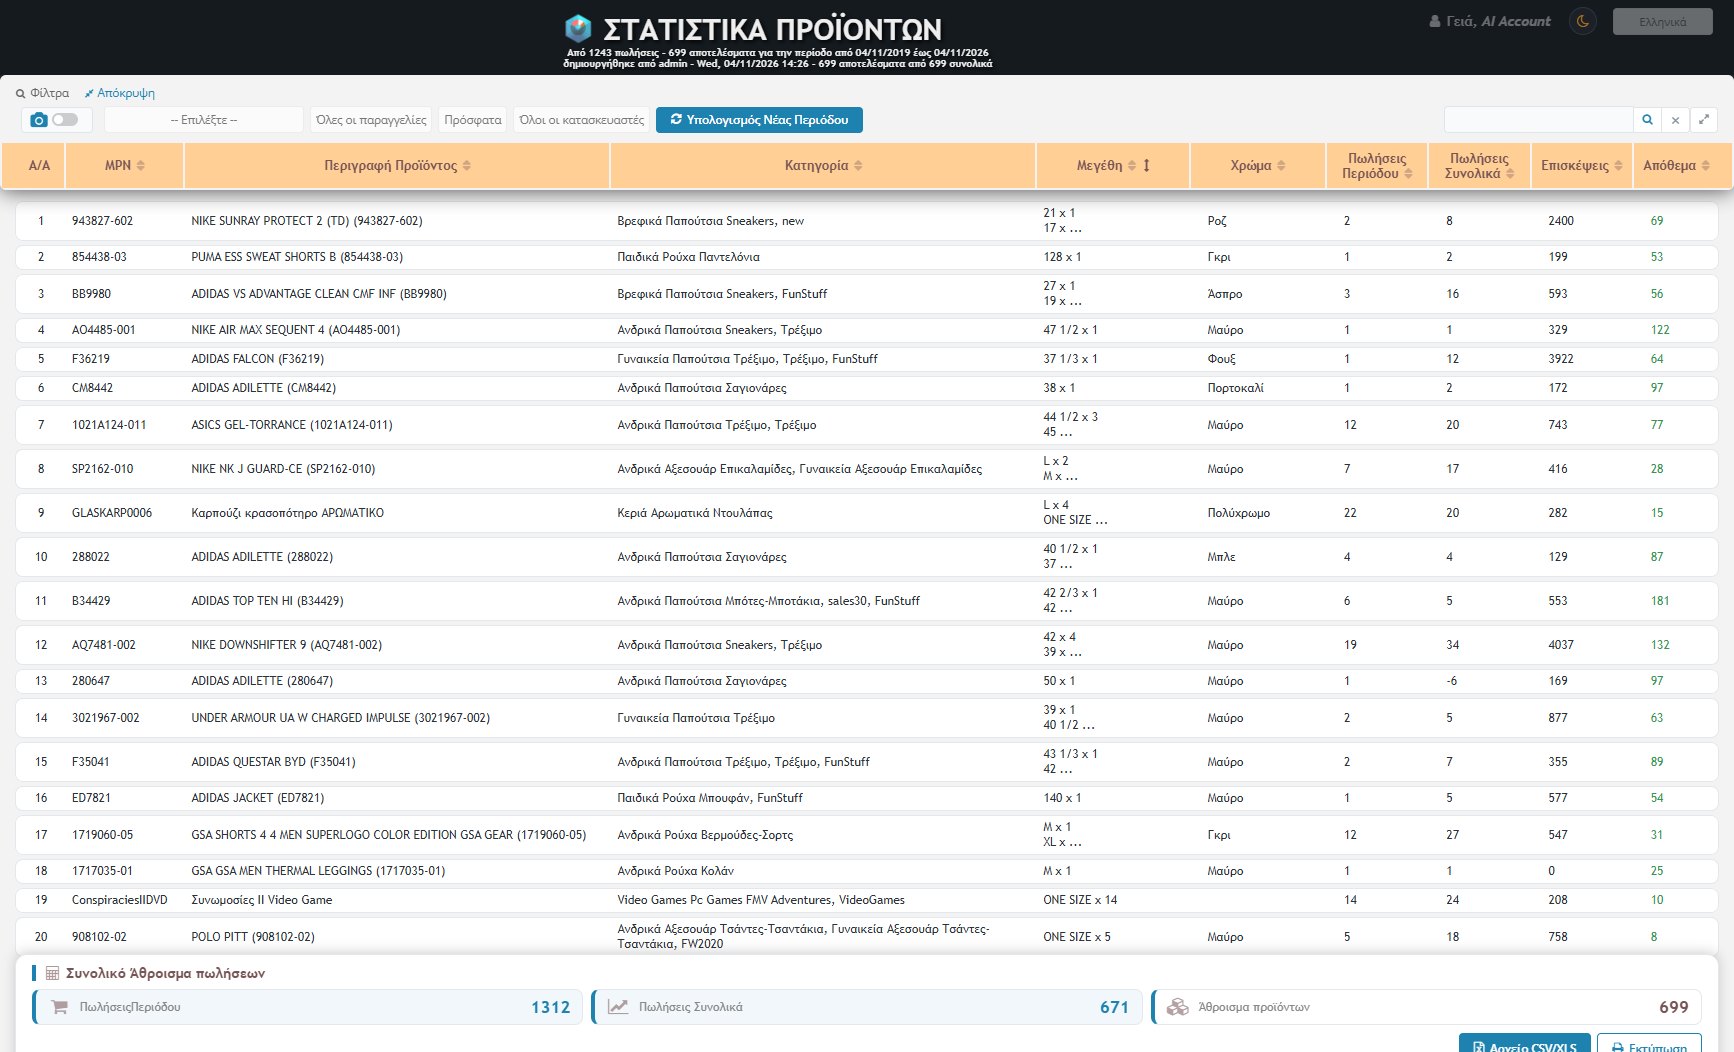
The MPN and the description of each row are links: by clicking them you open the detailed statistics of the product.
Filters and calculation
- Category (from the category tree) and Manufacturer.
- Order stage: you choose which orders will be counted (“All orders” or a specific stage).
- Photos: the switch shows or hides the thumbnails.
- Calculate New Period: you set a new date range and the page rebuilds the results. At the top it states which period was calculated, by whom and when, so a ready result opens quickly without a new calculation.
- Search in the list and sorting by clicking a column title (a second click reverses, a third clears).
Totals and export
Below the table a bar stays fixed with the totals (Period Sales, Total Sales, Sum of products) and the buttons CSV/XLS File and Print.
Detailed product statistics
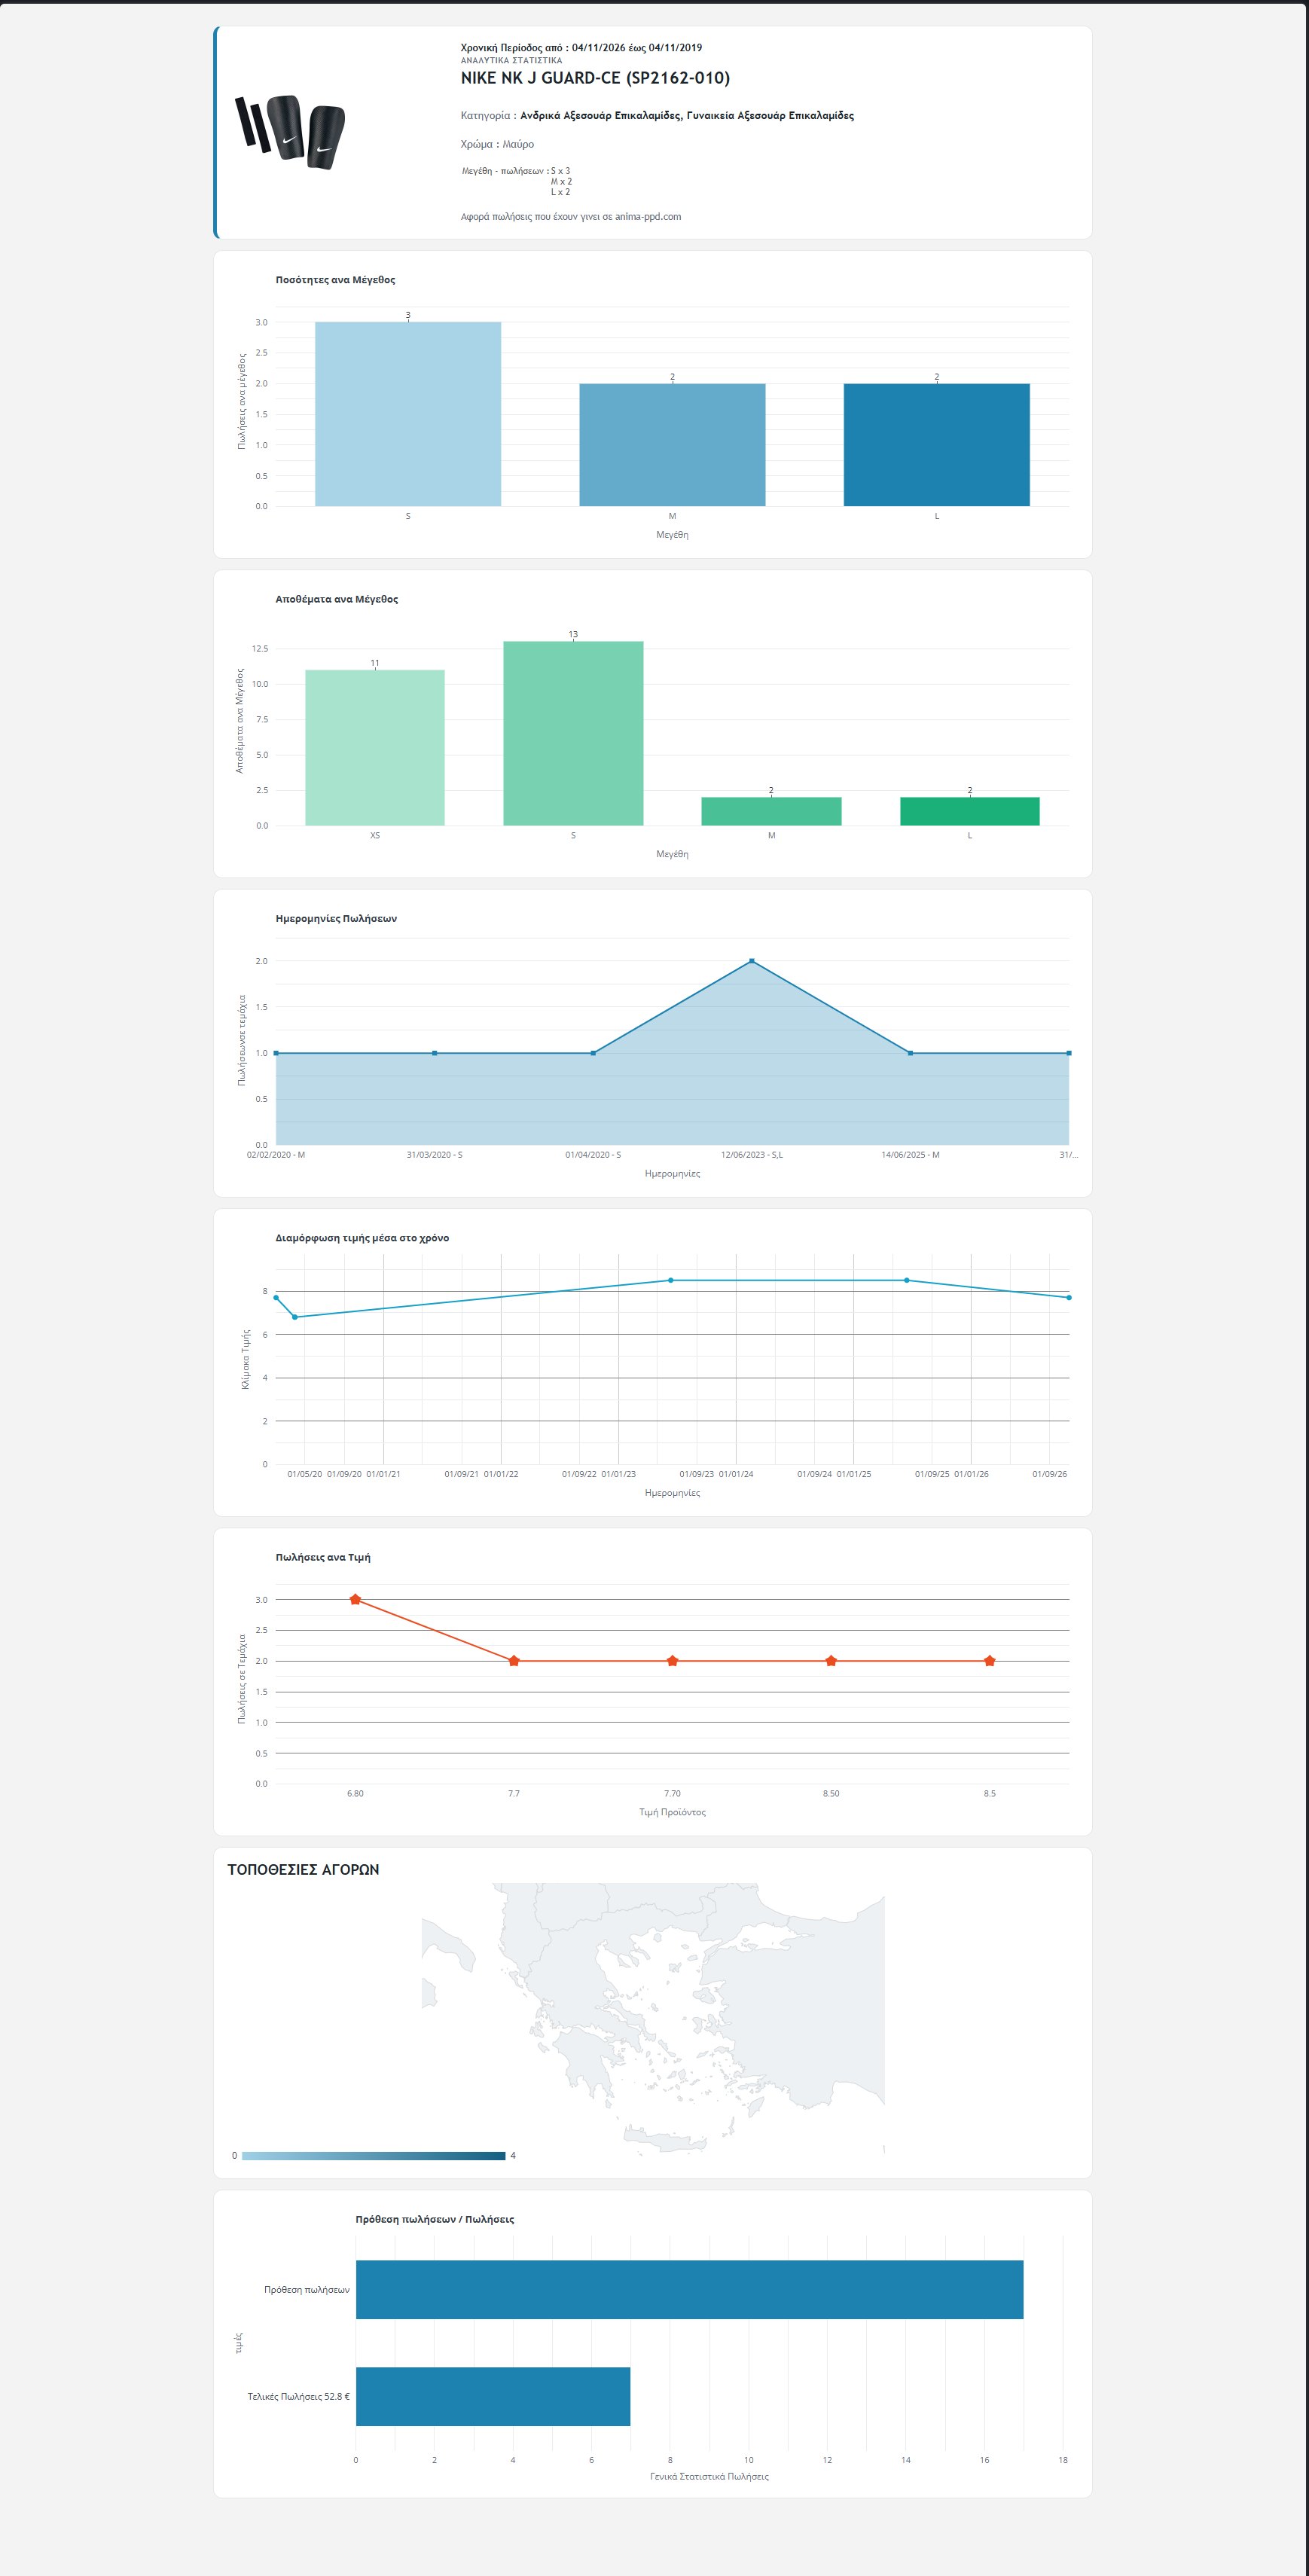
At the top you see the photo, the title, the category, the colour and the sizes with their sales, as well as the period being examined. Below are the charts:
- Quantities per size: how many pieces of each size were sold.
- Stock per size: how many pieces are now available in each size.
- Sales dates: when the sales were made and in which size.
- Price formation over time and Sales per price: how the price changed and at which price the pieces were sold.
- Purchase locations: a map with the areas of the buyers.
- Sales intent / Sales: a comparison of the pieces sold with the total amount of sales.
In a card at the bottom of the screen you see the product totals: final sales in pieces and in euros, original price, average price, lowest price and average discount. The Back and Print buttons take you back to the list or print the page.
Google Analytics, Google Ads and FB Analytics
Three shortcuts in the menu that open the corresponding tools directly: the Google Analytics of your store, Google Ads and Facebook Analytics. This way you have the traffic and advertising statistics in the same menu as the rest, without hunting for links.
- For the store to count visits in Google Analytics, the Google Analytics identifier must be set in the platform settings. The store then loads the corresponding tag automatically.